- National income, also known as national income accounting, is a measure of the total economic output or income generated within a country’s borders during a specific period, usually a year.
- It is a fundamental concept in economics and is used to assess the economic performance and well-being of a nation.
- National income is typically calculated using various methods, including the expenditure approach, income approach, and production approach
- National income is a key economic indicator that represents the total monetary value of all final goods and services produced by the residents of a country within a specific time frame, typically a year.
- It provides a snapshot of a nation’s economic health and is used to analyze and compare the economic performance of different countries.
- The calculation of national income involves several methods, with the most commonly used approaches being the production (or value-added), income, and expenditure methods.
Let’s briefly explore each of these methods:
Production (Value-Added) Method:
- This method calculates national income by summing up the value added at each stage of production in the economy.
- Value added is the difference between the value of output (goods and services produced) and the value of intermediate consumption (inputs used in production).
- The formula for this method is: National Income = Value of Gross Output – Value of Intermediate Consumption.
Income Method:
- The income method calculates national income by summing up all the incomes earned by the factors of production (i.e., labor, capital, land, and entrepreneurship) during the production process.
- It includes wages and salaries, rent, interest, and profits.
- The formula for this method is: National Income = Compensation of Employees + Gross Operating Surplus + Gross Mixed Income + Taxes on Production and Imports – Subsidies.
Expenditure Method:
- The expenditure method calculates national income by summing up all the expenditures made in the economy on final goods and services during a specific period.
- It includes consumption expenditure, investment expenditure, government spending, and net exports (exports minus imports).
- The formula for this method is: National Income = Consumption Expenditure + Investment Expenditure + Government Spending + (Exports – Imports).
Real national income, also known as real income or real Gross National Income (GNI), is a measure of a country’s total income or output that has been adjusted for inflation. It provides a more accurate picture of a nation’s economic performance over time because it accounts for changes in the general price level. Real national income is typically expressed in constant dollars or constant currency values, allowing for meaningful comparisons across different years.
Here are the key steps involved in calculating real national income:
Nominal National Income: Start with the nominal national income, which is the total income or output of a country without adjusting for inflation. This can be calculated using the income, expenditure, or production methods, as described in the previous response.
Price Index: Calculate a price index, such as the Consumer Price Index (CPI) or the Producer Price Index (PPI), for the base year and the current year. The base year is typically chosen as a reference point for measuring price changes.
Price Deflator: Compute a price deflator by dividing the price index for the current year by the price index for the base year. The result is a factor that represents the change in the overall price level between the base year and the current year.
Adjust for Inflation: Adjust the nominal national income for inflation by dividing it by the price deflator. This process removes the effect of price changes, providing a measure of real national income.
The formula for calculating real national income can be expressed as follows:
Real National Income = Nominal National Income / Price Deflator
1.2.Calculating National Income
Calculating national income involves measuring the total monetary value of all goods and services produced within a country’s borders during a specific time period, typically a year. National income is an essential economic indicator used to assess a country’s economic performance, standard of living, and overall economic health. Several methods can be used to calculate national income, including the production (or value-added) method, income method, and expenditure method. Here’s a step-by-step guide to calculating national income using the expenditure method:
Expenditure Method:
This method calculates national income by summing up all the expenditures made in the economy on final goods and services during a specific period. The formula for calculating national income using the expenditure method is as follows:
National Income (Y) = Consumption Expenditure (C) + Investment Expenditure (I) + Government Spending (G) + (Exports – Imports) (Net Exports)
Consumption Expenditure (C):
- This includes all spending by households on goods and services for personal use, such as food, clothing, housing, and entertainment.
- It does not include spending on intermediate goods or savings.
Investment Expenditure (I):
- This includes spending by businesses and individuals on capital goods like machinery, buildings, and equipment.
- It also includes changes in inventories.
- Government Spending (G):
- This represents all government expenditures on goods and services, including public administration, defense, education, and healthcare.
Net Exports (Exports – Imports):
- Net exports account for the difference between a country’s exports (goods and services sold to other countries) and imports (goods and services purchased from other countries).
- Gross Fixed Capital Formation (GFCF) is an economic indicator that measures the total value of investments made in new or replacement physical assets within an economy during a specific period, typically a year.
- It is a crucial component of a country’s national accounts and is used to assess the level of investment in physical infrastructure, machinery, equipment, and other productive assets.
- GFCF plays a significant role in economic growth and development because it reflects the capacity of an economy to produce goods and services efficiently.
- GFCF is a critical indicator of economic health because it reflects the level of investment in an economy.
- A high GFCF indicates that an economy is actively investing in capital assets, which can lead to increased production capacity, productivity, and potential for economic growth.
- An increase in GFCF is often associated with economic expansion and growth. When businesses and governments invest in new assets, it can stimulate economic activity, create jobs, and enhance productivity
Components: GFCF can be broken down into several components:
- Business Investment: This includes investments made by businesses in machinery, equipment, factories, and other productive assets.
- Residential Investment: This refers to investments in residential buildings, including housing construction.
- Government Investment: This includes public sector investments in infrastructure, public buildings, and other capital assets.
- Inventory Changes: Changes in inventories, such as the buildup of unsold goods, are sometimes included as part of GFCF.
Relationship with GDP: GFCF is a component of a country’s Gross Domestic Product (GDP). The relationship between GFCF and GDP is expressed in the following way:
- GDP = Consumption (C) + Gross Fixed Capital Formation (GFCF) + Government Spending (G) + (Exports – Imports) (Net Exports)
Per capita income, often referred to as income per capita, is a measure of the average income earned by each individual in a given country, region, or area within a specific time period, typically a year. It is an important economic indicator used to assess the standard of living and the overall economic well-being of a population.
To calculate per capita income, you need two key pieces of information:
Total Income: This is the total income generated within the geographic area under consideration, such as a country or a region, during the specified time period. It includes income from various sources, such as wages and salaries, self-employment income, investments, rents, and transfer payments like social security benefits.
Population: This is the total number of individuals living within the same geographic area during the same time period.
Once you have these two pieces of data, you can calculate per capita income using the following formula:
Per Capita Income = Total Income / Population
4.Purchasing Power Parity (PPP)
Purchasing Power Parity (PPP) is an economic theory and exchange rate system used to compare the relative value of currencies in terms of their purchasing power. PPP theory posits that in the absence of transportation costs and other trade barriers, identical goods should sell for the same price in different countries when expressed in a common currency. In other words, PPP suggests that exchange rates should adjust to equalize the purchasing power of different currencies.
Relative Prices: PPP is based on the idea that exchange rates should reflect the relative prices of identical goods and services in different countries. If a good is more expensive in one country than in another, the exchange rate should adjust so that it becomes cheaper to purchase the good in the country where it is relatively less expensive
Price Level Index: PPP is often used to calculate a Price Level Index, which compares the general price levels of different countries. This index can be used to determine whether a currency is undervalued or overvalued compared to a reference currency (typically the U.S. dollar)
Big Mac Index: The Big Mac Index is a popular and informal application of PPP theory, where the price of a Big Mac burger is used to compare purchasing power across countries. It assumes that a Big Mac should have a similar price in different countries when adjusted for exchange rates.
Absolute and Relative PPP: PPP theory comes in two forms:
- Absolute PPP: This suggests that exchange rates should adjust so that the same basket of goods has the same nominal price in different countries when expressed in a common currency. In practice, absolute PPP is rarely observed due to factors like transportation costs, trade barriers, and differences in non-tradable goods.
- Relative PPP: Relative PPP is a more flexible concept that suggests exchange rates should adjust to equalize the relative price levels of different countries. It allows for deviations in prices due to factors like transportation costs, tariffs, and non-tradable goods.
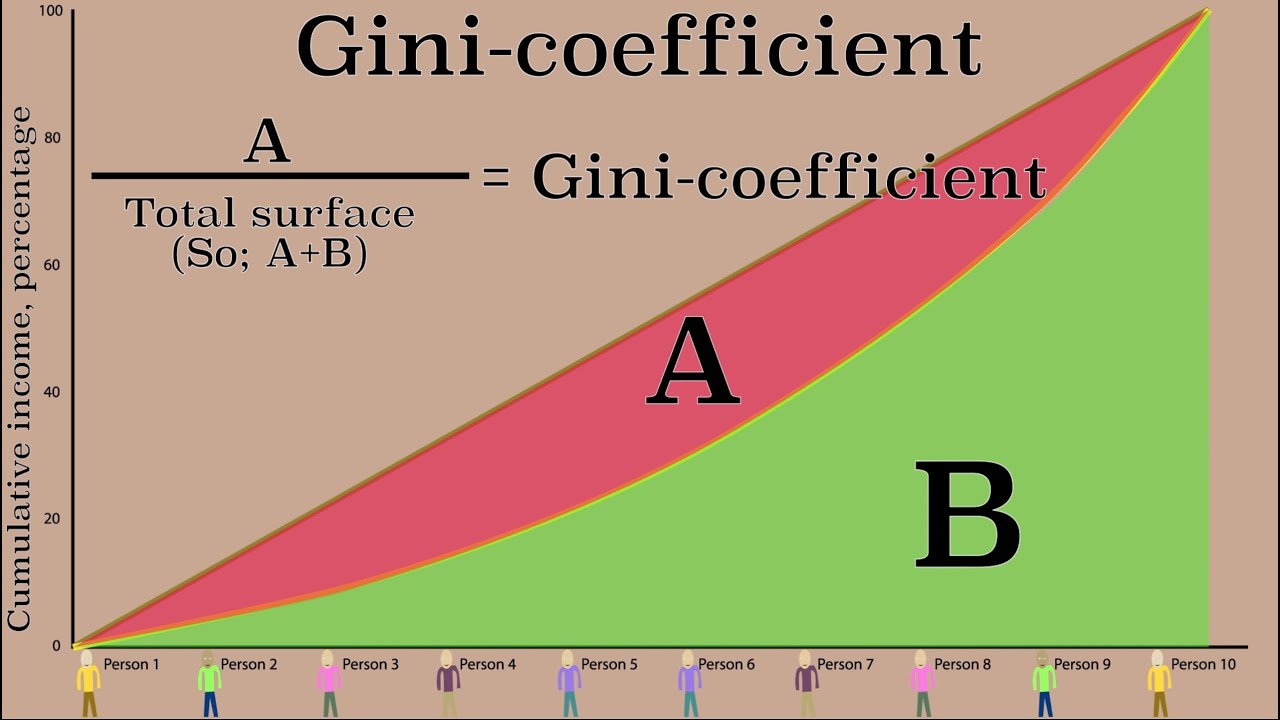
Gini coefficients range from 0 to 1 (or 0% to 100%).
- A Gini coefficient of 0 represents perfect income or wealth equality, where every person or household has an equal share of income or wealth.
- A Gini coefficient of 1 (or 100%) indicates perfect income or wealth inequality, where one person or household possesses all income or wealth, while everyone else has none.
- A low Gini coefficient (e.g., 0.2 or 20%) suggests a relatively equal distribution of income or wealth.
- A moderate Gini coefficient (e.g., 0.4 or 40%) indicates a moderate level of inequality.
- A high Gini coefficient (e.g., 0.6 or 60%) signals a significant level of inequality